Archive for October, 2007

Compiler tricks in x86 assembly: Ternary operator optimization

Thursday, October 18th, 2007

One relatively common compiler optimization that can be handy to quickly recognize relates to conditional assignment (where a variable is conditionally assigned either one value or an alternate value). This optimization typically happens when the ternary operator in C (“?:”) is used, although it can also be used in code like so:

// var = condition ? value1 : value2;
if (condition)
  var = value1;
else
  var = value2;

The primary optimization that the compiler would try to make here is the elimination of explicit branch instructions.

Although conditional move operations were added to the x86 instruction set around the time of the Pentium II, the Microsoft C compiler still does not use them by default when targeting x86 platforms (in contrast, x64 compiler uses them extensively). However, there are still some tricks that the compiler has at its disposal to perform such conditional assignments without branch instructions.

This is possible through clever use of the “conditional set (setcc)” family of instructions (e.g. setz), which store either a zero or a one into a register without requiring a branch. For example, here’s an example that I came across recently:

xor     ecx, ecx
cmp     al, 30h
mov     eax, [ebp+PacketLeader]
setnz   cl
dec     ecx
and     ecx, 0C6C6C6C7h
add     ecx, 69696969h
mov     [eax], ecx

Broken up into the individual relevant steps, this code is something along the lines of the following in pseudo-code:

if (eax == 0x30)
  ecx = 0;
else
  ecx = 1;

ecx--; // after, ecx is either 0 or 0xFFFFFFFF (-1)
ecx &= 0x30303030 - 0x69696969; // 0xC6C6C6C7
ecx += 0x69696969;

The key trick here is the use of a setcc instruction, followed by a dec instruction and an and instruction. If one takes a minute to look at the code, the meaning of these three instructions in sequence becomes apparent. Specifically, a setcc followed by a dec sets a register to either 0 or 0xFFFFFFFF (-1) based on a particular condition flag. Following which the register is ANDed with a constant, which depending on whether the register is 0 or -1 will result in the register being set to the constant or being left at zero (since anything AND zero is zero, while ANDing any particular value with 0xFFFFFFFF yields the input value). After this sequence, a second constant is summed with the current value of the register, yielding the desired result of the operation.

(The initial constant is chosen such that adding the second constant to it results in one of the values of the conditional assignment, where the second constant is the other possible value in the conditional assignment.)

Cleaned up a bit, this code might look more like so:

*PacketLeader = (eax == 0x30 ? 0x30303030 : 0x69696969);

This sort of trick is also often used where something is conditionally set to either zero or some other value, in which case the “add” trick can be omitted and the non-zero conditonal assignment value is used in the AND step.

A similar construct with the sbb instruction and the carry flag can also be constructed (as opposed to setcc, if sbb is more convenient for the particular case at hand). For example, the sbb approach tends to be preferred by the compiler when setting a value to zero or -1 as a further optimization on this theme as it avoids the need to decrement, assuming that the input value was already zero initially and the condition is specified via the carry flag.

You know that security is becoming mainstream when it shows up in comics…

Wednesday, October 17th, 2007

I recently saw a link to a rather amusing XKCD comic strip in one of the SILC channels that I frequent. I don’t usually forward these sorts of things along, but this one seemed unique enough to warrant it:

Exploits of a Mom

Hey, nobody said that security can’t have a little humor injected into it from time to time.

SQL injection attacks continue to be one of the most common attack vectors for web-based applications. I recently saw someone just search through random links found via Google that were to dynamically generated pages which took some sort of database identifier on their query string. The idea was to change the URLs found to have “dangerous” characters in their query parameters, and then see who died with a database error. The number of sites running code that didn’t escape obvious database queries in Q4 2007 was quite depressing, as I recall.

Terminal Server tricks: Restrict “\\tsclient” drive redirection to certain directories

Tuesday, October 16th, 2007

One particularly handy feature of recent Terminal Server (MSTSC) clients is the capability to redirect drives to the remote TS / RDP server for use in the RDP session. This is the mechanism by which you can go to \\tsclient\<driveletter> and access your data over the RDP session, without having to try and map a drive back the computer hosting the session via SMB or the like.

Although this capability is convenient, in its present form it is limited to just mapping entire drive letters; there does not appear to be a way to limit the scope of the filesystem that is redirected to a remote system to anything less than an entire drive letter. This is unfortunate, as especially with RDP-TLS, drive mapping over RDP presents a simple, secure, and attractive file copy mechanism for computers that that you want can RDP into.

The unfortunate part is more that if you don’t trust the computer that you are remoting into completely, then it’s rather dangerous to give it unrestricted access (within the confines of the user account mstsc.exe is executing as) to local drives; there’s a lot of damage that a malicious RDP server could do with that kind of access. Even if you’re a limited user, the RDP server could still steal and/or trash all your personal documents (which are again usually the most valuable data on a computer anyway).

There is, however, a little trick that you can use to try to limit the scope of RDP drive mappings. Recall that mstsc redirects drives based on drive letters; this would at first glance seem to prevent one from using any finer granularity of access than entire volumes with respect to which portions of the filesystem are made available to the RDP server. This is not actually the case if one is a bit clever, however, because RDP can also remote drive letters that correspond to mapped network drives, and not just local volumes that have a drive letter associated with them.

With this trick, one can, say, map a drive letter to localhost at a directory under a particular drive, to be the “root directory” that is presented to the remote RDP server. From there, it’s possible to just redirect the mapped drive letter over RDP and restrict what portions of the local filesystem are accessible to the RDP server.

Note that until Vista, plain users cannot arbitrarily map to \\localhost\c$ (or other built-in shares). As a result, if you’re in the pre-Vista boat (on the client side), an administrator will need to create the share for you (since you are running as a limited user, right?) so that you can map a drive letter to it.

Edit: Hyperion points out that you can use the “subst” command to achieve the same effect as mapping a drive letter to localhost. This is actually better than what I had been doing with drive mappings, as in downlevel (pre-Vista) scenarios, you don’t have the extra headache of having to get an administrator to share out a directory for you to be able to map it as a plain user.

Things that make you go “hmm”…

Monday, October 15th, 2007

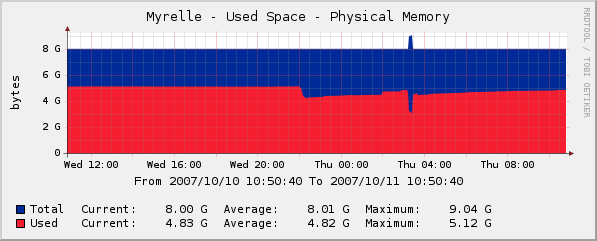
Evidently, a couple nights ago at 2:30am or so, my datacenter box grew an extra ~1GB of RAM for about 10 minutes:

Myrelle - Physical Memory Usage

Unfortunately, the magical mystery RAM (for lack of a better word) disappeared after about 10 minutes. Too bad, more RAM would have always been welcome…

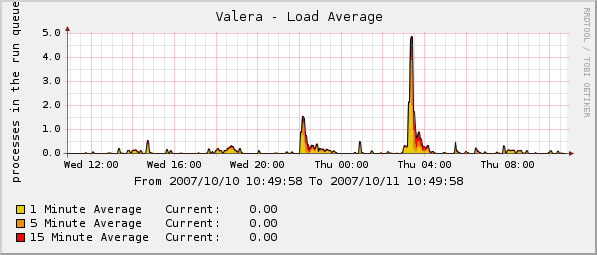
It seems that there’s some sort of strange bug with either Cacti or the SNMP utilities that it is using to query data, which occurs when the box is under load. At the time when the anomalous measurements were returned, there was a transitory jump in load average on the monitoring system (if the Cacti graphs are to be believed this time around):

Valera - Load Average

(Did I mention that things have a general tendency to break in strange and mysterious ways while in my presence?)

Anyways, now I have to wonder how reliable my other Cacti graphs are after this little discovery. This time, at least, the discrepancy was fairly obvious…

Fast kernel debugging for VMware, part 7: Review and Final Comments

Friday, October 12th, 2007

This is the final post in the VMKD series, a set of articles describing a program that greatly enhances the performance of kernel debugging in VMware virtual machines.

The following posts are members of the VMKD series:

  1. Fast kernel debugging for VMware, part 1: Overview
  2. Fast kernel debugging for VMware, part 2: KD Transport Module Interface
  3. Fast kernel debugging for VMware, part 3: Guest to Host Communication Overview
  4. Fast kernel debugging for VMware, part 4: Communicating with the VMware VMM
  5. Fast kernel debugging for VMware, part 5: Bridging the Gap to DbgEng.dll
  6. Fast kernel debugging for VMware, part 6: Roadmap to Future Improvements
  7. Fast kernel debugging for VMware, part 7: Review and Final Comments

At this point, the basic concepts behind how VMKD accelerates the kernel debugging experience in VMware should at the very least be vaguely familiar. This doesn’t mean that the story ends with VMKD, however. Many of the general, high-level concepts that VMKD uses to improve the performance of kernel debugging guests can be applied to other areas of the system.

That is to say, there are a number of implications outside of simply kernel debugging that are worth considering in the new reality that pervasive virtualization presents to us. Virtualization aware operating systems and applications present the potential for significant improvements in performance, user experience, and raw capabilities pretty much across the board as we move from seeing virtualization as a way to abstract interfaces intended to communicate with real hardware into a world where operating systems and drivers may more commonly be fully cognizent of the fact that they are operating in a VM. For example, one could conceivably imagine a time when 3D video performance approaches native performance on “bare metal”, thanks to virtualization awareness in display drivers and the interfaces they use to talk to the outside world.

In that respect, it seems logical to me that there may eventually become a time when virtualization is no longer simply about creating the virtual illusion of a physical machine. Instead, it may come to pass that virtualization ends up being more about providing an optimized “virtual platform” that does away with the constraints of hardware interfaces that are designed to be accessed by a single operating system at at time, in favor of a more abstract model where resources are natively accessed and shared by virtualized operating systems in a fashion that considers a virtual platform as a first class citizen rather than a mere echo of a physical machine.

Virtualization is here to stay. The sooner that it becomes accepted as a first class citizen in the operating system world, the better, I say.

Fast kernel debugging for VMware, part 6: Roadmap to Future Improvements

Thursday, October 11th, 2007

Yesterday’s article described how VMKD currently communicates with DbgEng.dll in order to complete the high-speed connection between a local kernel debugger and the KD stub code running in a VM. At this point, VMKD is essentially operational, with significant improvements over conventional virtual serial port kernel debugging.

That is not to say, however, that nothing remains that could be improved in VMKD. There are a number of areas where significant steps forward could be taken with respect to either performance or end user experience, given a native (in the OS and in VMMs) implementation of the basic concepts behind VMKD. For example, despite the greatly accelerated data rate of VMKD-style kernel debugging, the 1394 kernel debugger transport still outpaces it for writing dump files. (Practically speaking, all operations except writing dump files are much faster on VMKD when compared to 1394.)

This is because the 1394 KD transport can “cheat” when it comes to physical memory reads. As the reader may or may not be aware, 1394 essentially provides an interface to directly access the target’s raw physical memory. DbgEng takes advantage of this capability, and overrides the normal functionality for reading physical memory on the target. Where all other transports send a multitude of DbgKdReadPhysicalMemoryApi packets to the target computer, requesting chunks of physical memory 4000 bytes at a time (4000 bytes is the maximum size of a KD packet across any transport), the 1394 KD client in DbgEng simply pulls the target computer’s physical memory directly “off the wire”, without needing to invoke the DbgKdReadPhysicalMemoryApi request for every 4000 bytes.

This optimization turns out to present very large performance improvements with respect to reading physical memory, as a request to write a dump file is at heart essentially just a large memcpy request, asking to copy the entire contents of physical memory of the target computer to the debugger so that the data can be written to a file. The 1394 KD client approach greatly reduces the amount of code that needs to run for every 4000 bytes of memory, especially in the VM case where every KD request and response pair involve separate VM exits and all the code that such operations involve, on top of all the processing logic guest-side when handling the DbgKdReadPhysicalMemoryApi request and sending the response data.

The same sort of optimization can of course be done in principal for virtual machine kernel debugging, but DbgEng lacks a pluggable interface to perform the highly optimized transfer of raw physical memory contents across the wire. One optimization that could be done without the assistance of DbgEng would be to locally interpret the DbgKdReadPhysicalMemoryApi request VMM-side and handle it without ever passing the request on to the guest-side code, but even this is suboptimal as it introduces a (admittedly short for a local KD process) round trip for every 4000 bytes of physical memory. If the DbgEng team stepped up to the plate and provided such an extensible interface, it would be much easier to provide the sort of speeds that one sees with writing dumps based on local KD.

Another enhancement that could be done Microsoft-side would be a better interface for replacing KD transport modules. Right now, due to the fact that ntoskrnl is static linked to KDCOM.DLL, the OS loader has a hardcoded hack that interprets the KD type in the OS loader options, loads one of the (hardcoded filenames) “kdcom.dll”, “kd1394.dll”, or “kdusb2.dll” modules, and inserts them into the loaded module list under the name “kdcom.dll”. Additionally, the KD transport module appears to be guarded by PatchGuard on Windows x64 editions (at least from the standpoint of PatchGuard 3), and on Windows Vista, Winload.exe enforces a signature check on the KD transport module. These checks are, unfortunately, not particularly conducive to allowing a third party to easily plug themselves into the KD transport path. (Unless virtualization vendors standardize on a way to signal the VMM that the guest wants attention, each virtualization platform is likely to need some slightly different code to effect a VM exit on each KdSendPacket and KdReceivePacket operation.)

Similarly, there are a number of enhancements that virtualization platform vendors could make VMM-side to make the VMKD-style approach more performant. For example, documented pluggable interfaces for communicating with the guest would be a huge step forward (although the virtualization vendor could just implement the whole KD transport replacement themselves instead of relying on a third party solution). VMware appears to be exploring this approach with VMCI, although this interface is unfortunately not supported on VMware Server or any other platforms besides VMware Workstation 6 to the best of my knowledge. Additionally, VMM authors are in the best position to provide documented and supported interfaces to allow pluggable code designed to interface with a VMM to directly access the register, physical, and virtual memory contexts of a given VM.

Virtualization vendors are also in a better position to integrate the installation and activation process for VMM plugins than a third party operating with no support or documentation. For example, the clumsy vmxinject.exe approach that VMKD takes to load its plugin code into the VMware VMM could be completely eliminated by a native architecture for installing, configuring, and loading VMM plugins (VMCI promises to take care of some of this, though not entirely to the extent that I’d hope).

I would strongly encourage Microsoft and virtualization vendors to work together on this front, as at least from the debugging experience (which is a non-trivial, popular use of virtual machines), there’s a significant potential for a better customer experience in the VM kernel debugging arena with a little cooperation here and there. VMKD is essentially a proof of concept showing that vast kernel debugging is absolutely technically possible for Windows virtual machines. Furthermore, with “inside knowledge” of either the kernel or the VMM, it would likely be trivial to implement the sort of pluggable interfaces that would have made the development and testing of VMKD a virtual walk in the park. In other words, if VMKD can be done without help from either Microsoft or VMware, it should be simple for virtualization vendors and Microsoft to implement similar functionality if they work together.

Next time: Parting shots, and thoughts on other improvements beyond simply fast kernel debugging in the virtualization space.

Fast kernel debugging for VMware, part 5: Bridging the Gap to DbgEng.dll

Wednesday, October 10th, 2007

The previous article in the virtualized kernel debugging series described some of the details behind how VMKD communicates with the outside world via some modifications to the VMware VMM.

Although getting from the operating system kernel to the outside world is certainly an important milestone with respect to improved virtual machine kernel debugging, it is still necessary to somehow connect the last set of dots between the modified VMware VMM and the debugger (DbgEng.dll). The debugger doesn’t really have native support for what VMKD attempts to do. Like the KD transport module code that runs in kernel mode on the target, DbgEng expects to be talking to a hardware interface (through a user mode accessible API) in order to send and receive data from the target.

There is some support in DbgEng that can be salvaged to communicate with the VMM-side portion of VMKD, which is the “native” support for debugging over named pipe (or TCP, the latter being apparently functional but completely undocumented, which is perhaps unsurprising as there’s no public server end for that as there is for named pipe kernel debugging). However, there’s a problem with using this part of DbgEng’s support for kernel debugging. Although it does allow us to easily talk to DbgEng without having to patch it (a definite plus, as patching two completely isolated programs from two different vendors is a recipe for an extremely brittle program), this support for named pipe or TCP transports for KD is not without its downsides.

Specifically, the named pipe and TCP transport logic is essentially a bolt-on, after-the-fact addition to the serial port (KDCOM) support in DbgEng. (This is why, among other things, kernel debugging over named pipe always starts with kd -k com:pipe,….) What this means in terms of VMKD is that DbgEng expects that anything that it would be speaking to over named pipe or TCP is going to be implementing the low-level KDCOM framing protocol, with the high level KD protocol running on top of that. The KDCOM framing protocol is unfortunately a fairly unwieldy and messy protocol (it is designed to work with minimal dependencies and without a reliable way of knowing whether the remote end of the serial port is even connected, much less receiving data).

Essentially, the KDCOM framing protocol is to TCP as the high level KD protocol is to, say, HTTP in terms of networking protocols. KDCOM takes care of all the low level goo with respect to retransmits, acknowledgments, and everything else about establishing and maintaining a reliable connection with the remote end of the kernel debugger connection. While KDCOM is nowhere near as complex as TCP (thankfully!), it is not without its share of nuances, and it is certainly not publicly documented. (There was originally some partial documentation of an ancient version of the KDCOM protocol released in the NT 3.51 DDK in terms of source code to a partially operational kernel debugger client, with additional aspects covered in the Windows 2000 DDK. There is unfortunately no mention at all of any of this in any recent DDKs or WDKs, as KDCOM has long since disappeared into “no longer documented land”, an irritating habit of many old kernel APIs.)

The fact that there is no way to directly inject high level KD protocol data into DbgEng (aside from patching non-exported internal routines in the debugger, which is certainly no desirable from a future compatibility standpoint) presents a rather troublesome problem. By virtue of taking the approach of replacing KdSendPacket and KdReceivePacket in the guest, the code that was formerly responsible for maintaining the server-end of the low-level KDCOM link is no longer in use. That is, the data coming out of the kernel is raw high-level KD protocol data and not KDCOM data, and yet DbgEng can only interpret KDCOM-framed data over TCP or named pipe.

The solution that I ended up developing to counteract this problem, while a logical consequence of this limitation, is nonetheless unwieldy. In order to communicate with DbgEng, VMKD essentially had to re-implement the entire low-level KDCOM framing protocol so that KD packets can be transferred to and received from an unmodified DbgEng using the already-existing KDCOM over named pipe support. This approach entailed a rather unfortunate amount of extra baggage that needed to be carried around as many features of the KDCOM protocol are unnecessary in light of the new environment that local virtual machine kernel debugging presents.

In the interests of both reducing the complexity of the kernel mode code running in guest operating systems and improving the performance of VMKD (with respect to any possible “overhead traffic”, such as retransmits or resynchronization related requests), the KDCOM framing protocol is implemented host-side in the logic that is running in the modified VMM. This approach also had the additional advantage (during the development process) of the KDCOM framing logic being relatively easily debuggable with a conventional debugger on the host machine. This is in stark contrast to almost all of the guest-side kernel mode driver, which by virtue of being right in the middle of the communication path with the kernel debugger itself, happens to be unfortunately immune to being debugged via the conventional kernel debugger. (A VMM-implemented OS-agnostic debugger, similar in principal to a hardware debugger (ICE) could conceivably have been used to debug the guest-side driver logic if necessary, but putting the KDCOM framing code in user mode host-side is simply much more convenient.)

The KDCOM framing code in the host-side portion of VMKD fulfills the last major piece of the project. At this point, it is now possible to get kernel debugger send and receive requests into and out of the kernel with an accelerated interface that is optimized for execution in a VM, and successfully transport this data to and from DbgEng for consumption by the kernel debugger.

One alternative that I explored to intercepting execution at KdSendPacket and KdReceivePacket guest-side was to simply hook the internal KDCOM routines for sending and receiving characters from the serial port. This approach, while saving the trouble of having to reimplement KDCOM essentially from the ground up, proved problematic and less reliable than I had initially hoped (I suspect timing and buffering differences from a real 16-byte-buffering UART were at fault for the reliability issues this approach encountered). Furthermore, such an approach was in general somewhat less performant than the KdSendPacket and KdReceivePacket solution, as all of the KDCOM “meta-traffic” with respect to resends, acknowledgments, and the like needed to traverse the guest to host boundary instead of being confined to just the host as in the model that VMKD uses currently.

Next time: Future directions that could be taken on VMKD’s general approach to improving the kernel debugging experience with respect to virtual machines.

Fast kernel debugging for VMware, part 4: Communicating with the VMware VMM

Tuesday, October 9th, 2007

Yesterday, I outlined some of the general principles behind how guest to host communication in VMs work, and why the virtual serial port isn’t really all that great of a way to talk to the outside world from a VM. Keeping this information in mind, it should be possible to do much better in a VM, but it is first necessary to develop a way to communicate with the outside world from within a VMware guest.

It turns out that, as previously mentioned, that there happen to be a lot of things already built-in to VMware that need to escape from the guest in order to notify the host of some special event. Aside from the enhanced (virtualization-aware) hardware drivers that ship with VMware Tools (the VMware virtualization-aware addon package for VMware guests), for example, there are a number of “convenience features” that utilize specialized back-channel communication interfaces to talk to code running in the VMM.

While not publicly documented by VMware, these interfaces have been reverse engineered and pseudo-documented publicly by enterprising third parties. It turns out the VMware has a generalized interface (a “fake” I/O port) that can be accessed to essentially call a predefined function running in the VMM, which performs the requested task and returns to the VM. This “fake” I/O port does not correspond to how other I/O ports work (in particular, additional registers are used). Virtually all (no pun intended) of the VMware Tools “convenience features”, from mouse pointer tracking to host to guest time synchronization use the VMware I/O port to perform their magic.

Because there is already information publicly available regarding the I/O port, and because many of the tasks performed using it are relatively easy to find host-side in terms of the code that runs, the I/O port is an attractive target for a communication mechanism. The mechanisms by which to use it guest-side have been publicly documented enough to be fairly easy to use from a code standpoint. However, there’s still the problem of what happens once the I/O port is triggered, as there isn’t exactly a built-in command that does anything like take data and magically send it to the kernel debugger.

For this, as alluded to previously, it is necessary to do a bit of poking around in the VMware VMM in order to locate a handler for an I/O port command that would be feasible to replace for purposes of shuttling data in and out of the VM to the kernel debugger. Although the VMware Tools I/O port interface is likely not designed (VMM-side, anyway) for high performance, high speed data transfers (at least compared to the mechanisms that, say, the virtualization-aware NIC driver might use), it is at the very least orders of magnitude better than the virtual serial port, certainly enough to provide serious performance improvements with respect to kernel debugging, assuming all goes according to plan.

Looking through the list of I/O port commands that have been publicly documented (if somewhat unofficially), there are one or two that could possibly be replaced without any real negative impacts on the operation of the VM itself. One of these commands (0x12) is designed to pop-up the “Operating System Not Found” dialog. This command is actually used by the VMware BIOS code in the VM if it can’t find a bootable OS, and not typically by VMware Tools itself. Since any VM that anyone would possibly be kernel debugging must by definition have a bootable operating system installed, axing the “OS Not Found” dialog is certainly no great loss for that case. As an added bonus, because this I/O port command displays UI and accesses string resources, the handler for it happened to be fairly easy to locate in the VMM code.

In terms of the VMM code, the handler for the OS Not Found dialog command looks something like so:

int __cdecl OSNotFoundHandler()
{
   if (!IsVMInPrivilegedMode()) /* CPL=0 check */
   {
     log error message;
     return -1;
   }

   load string resources;
   display message box;

   return somefunc();
}

Our mission here is really to just patch out the existing code with something that knows how to talk to take data from the guest and move it to the kernel debugger, and vice versa. A naive approach might be to try and access the guest’s registers and use them to convey the data words to transfer (it would appear that many of the I/O port handlers do have access to the guest’s registers as many of the I/O port commands modify the register data of the guest), but this approach would incur a large number of VM exits and therefore be suboptimal.

A better approach would be to create some sort of shared memory region in the VM and then simply use the I/O port command as a signal that data is ready to be sent or that the VM is now waiting for data to be received. (The execution of the VM, or at least the current virtual CPU, appears to be suspended while the I/O port handler is running. In the case of the kernel debugger, all but one CPU would be halted while a KdSendPacket or KdReceivePacket call is being made, making the call essentially one that blocks execution of the entire VM until it returns.)

There’s a slight problem with this approach, however. There needs to be a way to communicate the address of the shared memory region from the guest to the modified VMM code, and then the modified VMM code needs to be able to translate the address supplied by the guest to an address in the VMM’s address space host-side. While the VMware VMM most assuredly has some sort of capability to do this, finding it and using it would make the (already somewhat invasive) patches to the VMM even more likely to break across VMware versions, making such an address translation approach undesirable from the perspective of someone doing this without the help of the actual vendor.

There is, however, a more unsophisticated approach that can be taken: The code running in the guest can simply allocate non-paged physical memory, fill it with a known value, and then have the host-side code (in the VMM) simply scan the entire VMM virtual address space for the known value set by the guest in order to locate the shared memory region in host-relative virtual address space. The approach is slow and about the farthest thing from elegant, but it does work (and it only needs to be done once per boot, assuming the VMM doesn’t move pinned physical pages around in its virtual address space). Even if the VMM does occasionally move pages around, it is possible to compensate for this, and assuming such moves are infrequent still achieve acceptable performance.

The astute reader might note that this introduces a slight hole whereby a user mode caller in the VM could spoof the signature used to locate the shared memory block and trick the VMM-side code into talking to it instead of the KD logic running in kernel mode (after creating the spoofed signature, a malicious user mode process would wait for the kernel mode code to try and contact the VMM, and hope that its spoofed region would be located first). This could certainly be solved by tighter integration with the VMM (and could be quite easily eliminated by having the guest code pass an address in a register which the VMM could translate instead of doing a string hunt through virtual address space), but in the interest of maintaining broad compatibility across VMware VMMs, I have not chosen to go this route for the initial release.

As it turns out, spoofing the link with the kernel debugger is not really all that much of a problem here, as due the way VMKD is designed, it is up to the guest-side code to actually act on the data that is moved into the shared memory region, and a non-privileged user mode process would have limited ability to do so. It could certainly attempt to confuse the kernel debugger, however.

After the guest-side virtual address of the shared memory region is established, the guest and the host-side code running in the VMM can now communicate by filling the shared memory region with data. The guest can then send the I/O port command in order to tell the host-side code to send the data in the shared memory region, and/or wait for and copy in data destined from a remote kernel debugger to the code running in the guest.

With this model, the guest is entirely responsible for driving the kernel debugger connection in that the VMM code is not allowed to touch the shared memory region unless it has exclusive access (which is true if and only if the VM is currently waiting on an I/O port call to the patched handler in the VMM). However, as the low-level KD data transmission model is synchronous and not event-driven, this does not pose a problem for our purposes, thus allowing a fairly simple and yet relatively performant mechanism to connect the KD stub in the kernel to the actual kernel debugger.

Now that data can be both received from the guest and sent to the guest by means of the I/O port interface combined with the shared memory region, all that remains is to interface the debugger (DbgEng.dll) with the patched I/O port handler running in the VMM.

It turns out that there’s a couple of twists relating to this final step that make it more difficult than what one might initially expect, however. Expect to see details on that (and more) on the next installment of the VMKD series…

Fast kernel debugging for VMware, part 3: Guest to Host Communication Overview

Monday, October 8th, 2007

In the previous installment of this series, I outlined the basic architecture of the KD transport module interface from the perspective of the kernel. This article focuses upon the next step in the fast VM KD project, which is getting data out of the VM (or in and out of VMs in general, when dealing with virtualization).

At this point, it’s all but decided that the way to gain access to KD traffic kernel-side is to either intercept or replace KdSendPacket and KdReceivePacket, or some dependecy of those routines through which KD data traffic flows. However, once access to KD traffic is gained, there is still the matter of getting data out of the VM and to the host (and from there to the kernel debugger), as well as moving data from the kernel debugger to the host and then the VM. To better understand how it is possible to improve upon a virtual serial port in terms of kernel debugging in a VM, however, it is first necessary to gain a basic working understanding of how VMMs virtualize hardware devices.

While a conventional kernel debugger transport module uses a physical I/O device that is connected via cable to the kernel debugger computer, this is essentially an obsolete way of approaching the matter for a virtual machine, as the VMM running on the host has direct access to the guest’s memory. Furthermore, practically all VMMs (of which VMware is certainly no exception) typically have a “back-channel” communication mechanism by which the guest can communicate with the host and vice versa, without going through the confines of hardware interfaces that were designed and implemented for physical devices. For example, the accelerated video and network drivers that most virtualization products ship typically use such a back-channel interface to move data into and out of the guest in an efficient fashion.

The typical optimization that is done with these accelerated drivers is to buffer data in some sort of shared or pre-registered memory region until a complete “transaction” of some sort is finished, following which the guest (or host) is notified that there is data to be processed. This approach is typically taken because it is advantageous to avoid any VM exit, that is, any event that diverts control flow away from the guest code and into code living in the VMM. Such actions are necessary because the VM by design does not have truly direct access to physical hardware devices (and indeed in many cases, such as with the NICs that are virtualized by most VM software, the hardware interface presented to the guest are likely to be completely incompatible with those in use in reality on the physical host for such devices).

A VMM handles this sort of case by arranging to gaining control when a dangerous or privileged operation, such as a hardware access, is being attempted. Now, although this does allow the VMM to emulate the operation and return control to the guest after performing the requested operation, many pre-existing hardware interfaces are not typically all that optimal for direct emulation by a VMM. The reason for this, it turns out, is typically that a VM exit is a fairly expensive operation (relative to many types of direct hardware access on a physical machine, such as a port I/O attempt), and many pre-existing hardware interfaces tend to assume that talking to the hardware is a fairly high-speed operation. Although emerging virtualization technologies (such as TLB tagging) are working to reduce the cost of VM exits, reducing them is definitely a good thing for performance, especially with current-generation virtualization hardware and software. To provide an example of how VM exits can incur a non-trivial performance overhead, with a serial port, one typically needs to perform an I/O access on every character, which means that a VM exit is being performed on every single character sent or received, at least in the fashion that KDCOM.DLL uses the serial port.

Furthermore, other peculiars of hardware interfaces, such as a requirement to, say, busy-spin for a certain number of microseconds after making a particular request to ensure that the hardware has had time to process the request are also typically undesirable in a guest VM. (The fact that a VM exit happens on every character isn’t really the only performance drag in the case of a virtual serial port, either. There is also the fact that serial ports are only designed to operate at a set speed, and the VMware serial port will attempt to restrain itself to the baud rate. Together, these two aspects of how the virtual serial port function conspire to drag down the performance of virtual serial port kernel debugging to the familiar low-speeds that one might expect with kernel debugging over physical serial ports, if even that level of performance is reached.)

The strategy of buffering data until a complete “transaction” is ready to be sent or received is, as previously mentioned, one common way to improve the performance of virtual hardware device I/O; for example, a VM-optimized NIC driver might use a shared memory region to wait until complete packets are ready to be sent or received, and then use a VMM back-channel interface to arrange for the data to be processed in an event-driven fashion.

This is the general approach that would be ideal to take with the VMKD project, that is, to buffer data until a complete KD packet (or at least a sizable amount of data) is available, and then transmit (or receive) the data. Additionally, the programmed baud rate is really not something that VMKD needs to restrict itself to, the KD protocol doesn’t really have any inherent speed limits other than the fact that KDCOM.DLL is designed to talk to a real serial port, which does not have unlimited transfer speed.

In fact, if both KdSendPacket and KdReceivePacket were completely reimplemented guest-side, all the anachronisms associated with the aging serial port hardware interface could be completely discarded and the host-side transport logic for the VM could be freed to consider the most optimal mechanism to move data into and out of the VM. This is in principal much like how enhanced network card drivers provided by many virtualization vendors for their guests operate. To accomplish this, however, a workable method for communicating with the outside world from the perspective of the guest is needed.

Next time: The specifics of one approach for getting data into and out of VMware guests.

Fast kernel debugging for VMware, part 2: KD Transport Module Interface

Friday, October 5th, 2007

In the last post in this series, I outlined some of the basic ideas behind my project to speed kernel debugging on VMware. This posting expands upon some of the details of the kernel debugger API interface itself (from a kernel perspective).

The low level (transport or framing) portion of the KD interface is, as previously mentioned, abstracted from the kernel through a uniform interface. This interface consists of a standard set of routines that are exported from a particular KD transport module DLL, which are used to both communicate with the remote kernel debugger and notify the transport module of certain events (such as power transitions) so that the KD I/O hardware can be programmed appropriately. The following routines comprise this interface:

  1. KdD0Transition
  2. KdD3Transition
  3. KdDebuggerInitialize0
  4. KdDebuggerInitialize1
  5. KdReceivePacket
  6. KdRestore
  7. KdSave
  8. KdSendPacket

Most of these routines are related to power transition or KD enable/disable events (or system initialization). For the purposes of VMKD, these events are not really of a whole lot of interest as we don’t have any real hardware to program.

However, there are two APIs that are relevant: KdReceivePacket and KdSendPacket. These two routines are responsible for all of the communication between the kernel itself and the remote kernel debugger.

Although the KD transport module interface is not officially documented (or supported), it is not difficult to create prototypes for the exports that are relevant. The following are the prototypes that I have created for KdReceivePacket and KdSendPacket:

KD_RECV_CODE
KdReceivePacket(
	__in ULONG PacketType,
	__inout_opt PKD_BUFFER PacketData,
	__inout_opt PKD_BUFFER SecondaryData,
	__out_opt PULONG PayloadBytes,
	__inout_opt PKD_CONTEXT KdContext
	);

VOID
KdSendPacket(
	__in ULONG PacketType,
	__in PKD_BUFFER PacketData,
	__in_opt PKD_BUFFER SecondaryData,
	__inout PKD_CONTEXT KdContext
	);

typedef struct _KD_BUFFER
{
	USHORT  Length;
	USHORT  MaximumLength;
	PUCHAR  Data;
} KD_BUFFER, * PKD_BUFFER;

typedef struct _KD_CONTEXT
{
	ULONG   RetryCount;
	BOOLEAN BreakInRequested;
} KD_CONTEXT, * PKD_CONTEXT;

typedef enum _KD_RECV_CODE
{
	KD_RECV_CODE_OK       = 0,
	KD_RECV_CODE_TIMEOUT  = 1,
	KD_RECV_CODE_FAILED   = 2
} KD_RECV_CODE, * PKD_RECV_CODE;

At a high level glance, both of these routines operate synchronously and only return once the operation either times out or the data has been successfully transmitted or received by the remote end of the KD connection. Both routines are normally expected to be called with the kernel’s internal KD lock held and all but the current processor halted.

In general, both routines normally guarantee successful transmission or reception of data before they return. There are a couple of one-off exceptions to this rule, however:

  • KdSendPacket normally guarantees that the data has been received and acknowledged by the remote end. However, if the request being sent is a debug print notification, a symbol load notification, or a .kdfiles request, KdSendPacket contains a special exemption that allows the transmission to time out and silently fail after several attempts. This is because these requests can happen normally and don’t always warrant a debugger break in. (For example, a debug print doesn’t halt the system until you attach the kernel debugger because of this exemption.)
  • KdReceivePacket will keep trying to receive the packet until it either times out (i.e. there is no activity on the KD link for a specific amount of read attempts), successfully receives a good packet and acknowledges it, or receives a resend or resynchronize request (the latter two being specific to the KD protocol module and its internal framing protocol used “on the wire”).
  • KdReceivePacket supports a special type of request by the caller to check if there is a debugger present and requesting a break in at the instant in time when it is called (returning immediately with the result). This mode is used by the kernel on the system timer tick to periodically check if the kernel debugger is requesting to break in.

While the system is running normally, the kernel periodically invokes KdReceivePacket with the special mode that directs the KD transport to check for an immediate break in request. If no break in request is currently detected, then execution continues normally, otherwise the kernel enters into a loop where it waits for commands from the remote kernel debugger and acts upon any received requests, sending the responses back to the remote kernel debugger via KdSendPacket.

After the system is in the break-in receive loop, KdReceivePacket is called repeatedly while the rest of the system is halted and the KD lock is held. Commands that are successfully received are dispatched to the appropriate high level KD protocol request handler, and any response data is transmitted back to the kernel debugger, following which the receive loop continues so that the next request can be handled (unless the last request was one to resume execution, of course). The kernel can also enter the break-in receive loop in response to an exception, which is how tracing and breakpoint events are signalled to the remote kernel debugger.

Given all of this, it’s not difficult to see that reimplementing KdSendPacket and KdReceivePacket (or capturing the serial I/O that KDCOM does in its implementation of these routines) guest-side is the clear way to go for high speed kernel debugging for VMs. (Among other things, at the KdSendPacket and KdReceivePacket level, the contents of the high level KD protocol are essentially all but transparent to the transport module, which means that the high level KD protocol is free to continue to evolve without much chance of serious compatibility breaks with the low level KD transport modules.)

However, things are unfortunately not quite as simple as they might seem with that front. More on that in a future post.